What Should You Automate First? A Prioritization Framework
The Selection Problem
For most mid-market companies (10–200 employees), "automation" is a double-edged sword. On one side is the promise of streamlined operations; on the other is a graveyard of half-finished Zapier integrations and expensive software that nobody uses. The problem isn't the technology—it's the selection process.
When you are drowning in manual processes and tool sprawl, every friction point feels like a priority. But treating every bottleneck as equally urgent is a recipe for operational gridlock. To scale, you need a framework that filters noise and identifies the highest-leverage opportunities for business process automation.
The Concept of Operational Debt
Before we dive into the math, we must address why your team is overwhelmed. Most businesses suffer from "Operational Debt." Like technical debt, this is the cost of choosing a "quick and dirty" manual workaround over a scalable system.
Over time, these workarounds compound. A founder manually BCCing a CRM, an ops manager copy-pasting data from a CSV into a slide deck, or a team lead manually assigning tickets—these are high-interest loans. You are paying for them daily with your team's most expensive asset: focus. Automation prioritization is simply the process of deciding which loans to pay off first to reclaim the most "interest."
The HAR Labs Scoring Matrix: (F × T × E)
We use a three-factor multiplication formula to calculate the Automation Priority Score (APS). We rank on a scale of 1–5. Multiplication is intentional; it aggressively highlights the outliers that are killing your productivity.
1. Frequency (F): The Volume Factor
Frequency measures how often a task recurs. High-frequency tasks are the best candidates for automation because even small time savings compound into massive gains.
- 1: Quarterly or ad-hoc (e.g., updating a yearly board deck).
- 3: Weekly (e.g., preparing a Friday team report).
- 5: Daily or Continuous (e.g., processing new leads or syncing customer support tickets).
2. Time (T): The Labor Factor
Time measures the active "hands-on-keyboard" duration required to complete a single instance of the task.
- 1: < 5 minutes (Micro-tasks).
- 3: 30–60 minutes (Substantial deep work).
- 5: 3+ hours (High-intensity manual labor).
3. Error Rate (E): The Risk Factor
Error rate measures how often humans make mistakes in this process and the "blast radius" of those mistakes.
- 1: Low risk. Errors are trivial and self-correcting.
- 3: Moderate risk. Errors cause downstream delays or require 30+ minutes of cleanup.
- 5: Critical risk. Errors lead to lost revenue, broken compliance, or churned clients.
The Scoring Matrix in Action
To use this, list your top 10 most painful manual workflows. Score them 1–5 in each category, then multiply.
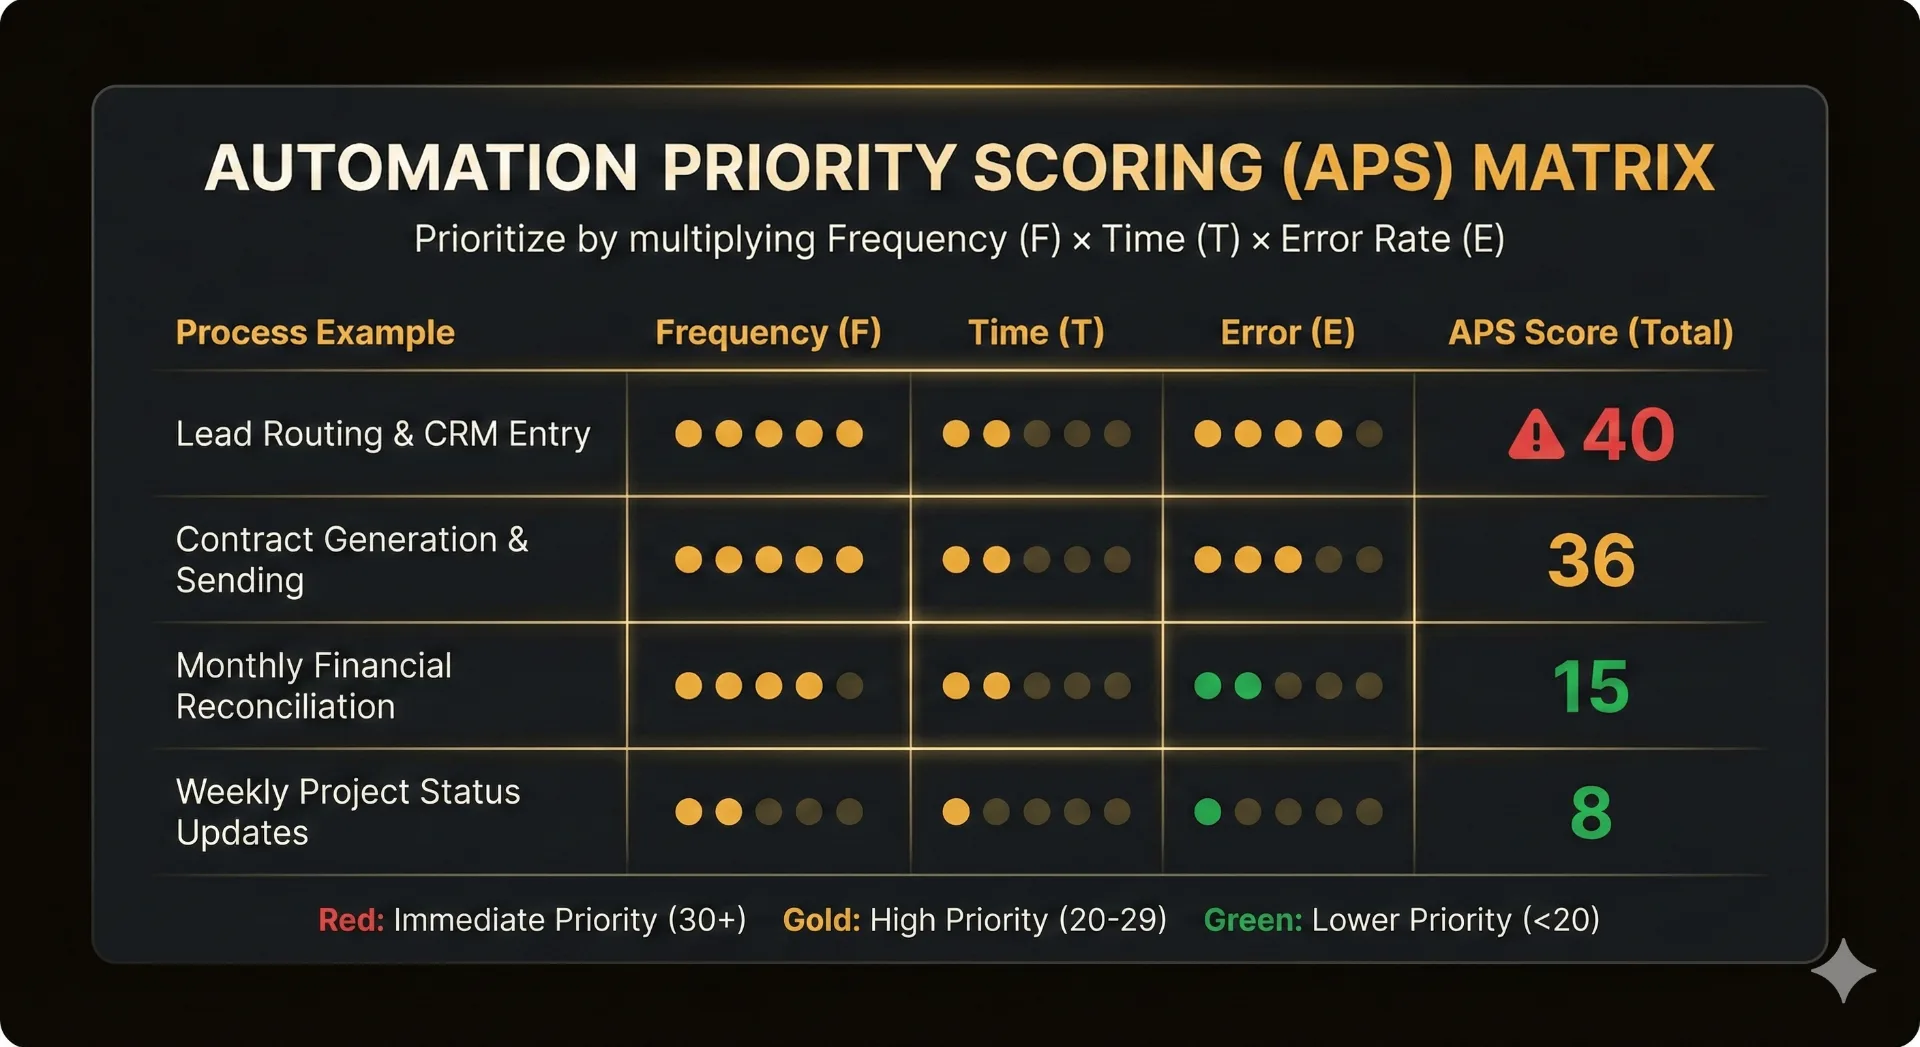
Why Case A (Lead Routing) Wins
A score of 40 indicates an immediate priority. Even though it only takes 10 minutes (Time: 2), it happens constantly (Frequency: 5) and mistakes lead to lost money (Error: 4). Automating this provides an immediate, daily "win" for the sales team and the bottom line.
Why Case C (Financial Recon) Waits
Despite being "hard" and taking 5 hours (Time: 5), it only happens once a month (Frequency: 1). Unless the error rate is catastrophic, your time is better spent fixing the daily lead routing issues first.
The Trap of "Tool Sprawl" and Over-Engineering
A common mistake in operations consulting is trying to automate a broken process. If your process is a mess, automation just makes the mess happen faster.
Before applying the matrix, perform a "Process Sanity Check":
- Eliminate: Do we even need this task? If the report isn't being read, don't automate it—kill it.
- Consolidate: Are we using three tools where one would suffice? Tool consolidation is often the most effective form of automation.
- Standardize: Can we make the manual steps the same every time? You cannot automate a "vibes-based" process. It needs logic, triggers, and defined outputs.
High-Leverage Categories for Mid-Market Firms
If you are looking for where to start, these categories typically yield the highest APS scores:
Sales & Marketing Operations
- Lead Enrichment: Automatically pulling LinkedIn or Clearbit data into your CRM when a form is submitted.
- Speed-to-Lead: Instant Slack notifications for high-intent leads to decrease response time.
Customer Success & Onboarding
- Provisioning: Automatically creating accounts in your product, Slack, or project management tools once a contract is signed in DocuSign.
- Survey Loops: Triggering NPS or feedback requests 30 days after a client goes live.
Internal Operations & Finance
- Expense Management: Using OCR to scan receipts and map them to QuickBooks categories.
- Reporting Dashboards: Moving away from manual CSV exports toward live Looker or PowerBI syncs via Fivetran or Airbyte.
Technical Feasibility vs. Business Value
Once you have your APS score, you must filter it through Technical Feasibility.
- Low Feasibility: Requires custom API development, lacks "hooks," or involves highly subjective human judgment.
- High Feasibility: Uses standard integrators (Zapier, Make, Workato) and has a clear "If This, Then That" logic.
The Golden Rule: Choose the highest APS score that also has High Feasibility. This is your "Low-Hanging Fruit."
Immediate Action Plan: The 48-Hour Sprint
Don't wait for a quarterly planning session. You can identify and solve your first bottleneck in 48 hours:
- Hour 0–2: Distribute the F × T × E matrix to your team leads. Have them submit their top 3 "time-suck" tasks.
- Hour 2–4: Score the submissions. Identify the single task with the highest APS.
- Hour 4–24: Map the process on a whiteboard (or Miro). Identify the Trigger (e.g., "New Row in Google Sheets") and the Action (e.g., "Send Slack Message").
- Hour 24–48: Build a "Minimum Viable Automation" (MVA). Use a no-code tool to automate just the first two steps.
Scaling Beyond the First Win
AI automation is not a "set it and forget it" project. It is a core competency of a modern, efficient business. As you knock out the high-score tasks, you will find that your team's capacity expands. The people who were previously tethered to data entry are now free to focus on workflow automation strategy or high-level client service.
Stop letting tool sprawl and manual overhead dictate your growth. Use the matrix, find your "40+ score" tasks, and start reclaiming your operations.
Reclaim Your Time and Scale with Confidence
Ready to score your own processes? Use our free Manual Tax Calculator to quantify exactly what your broken workflows are costing you—then apply the F × T × E matrix to prioritize.
At HAR Labs, we help operators cut through the noise and fix what matters first.
Try the Manual Tax Calculator